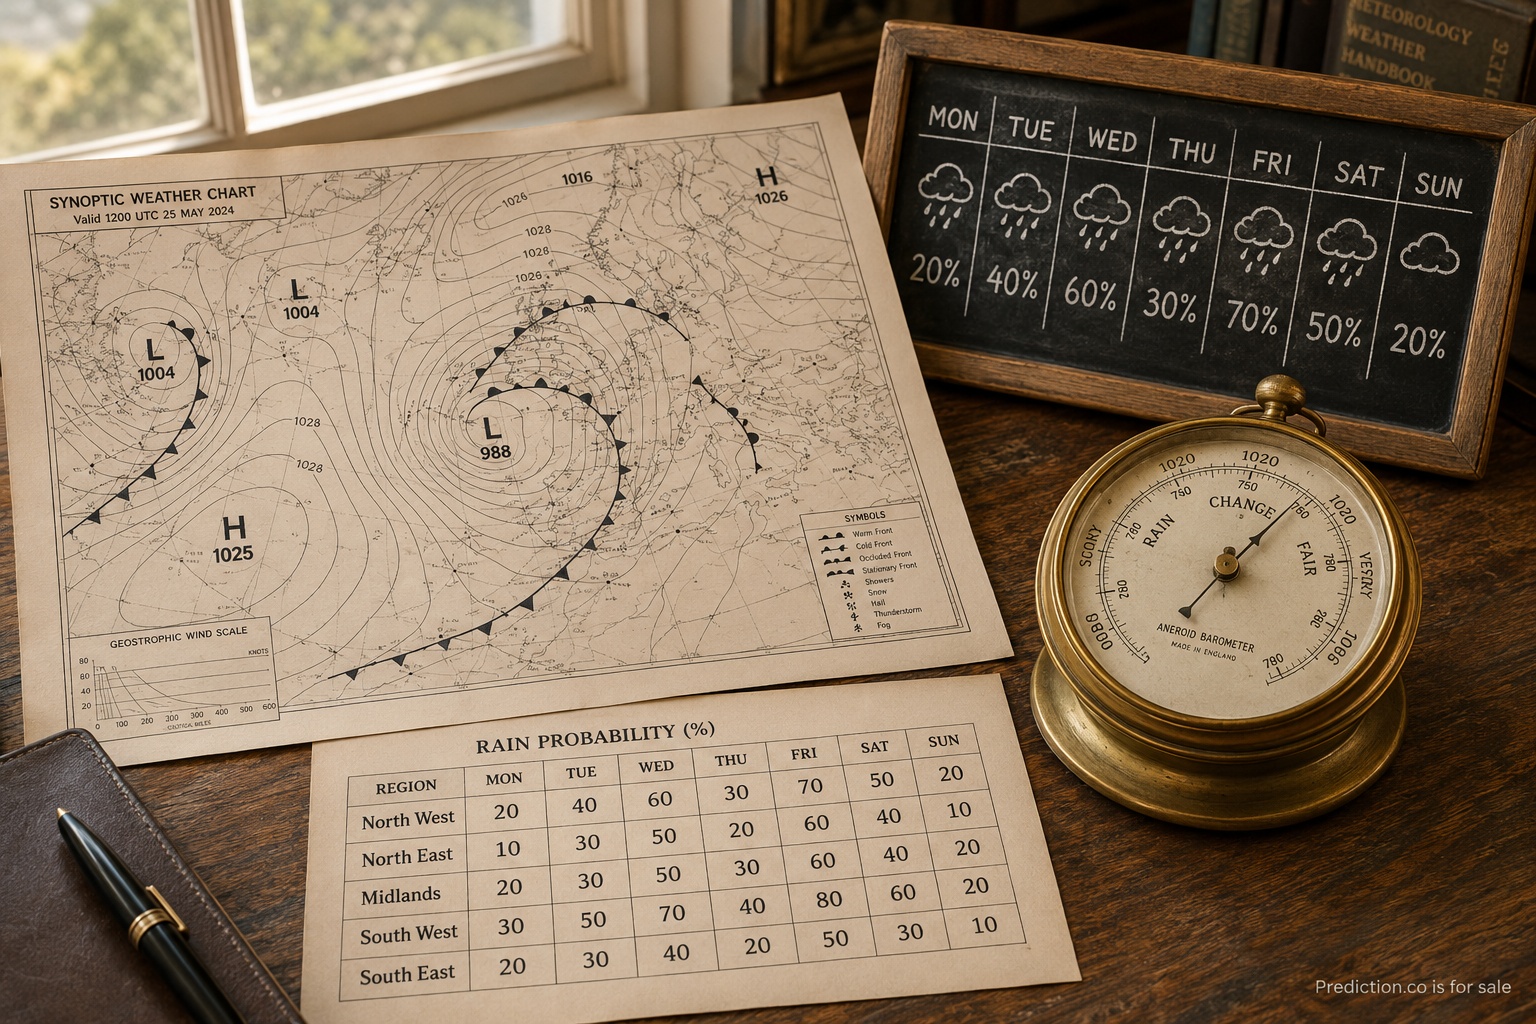
The most honest answer to “How accurate is the weather forecast?” is another question: accurate for what? Today’s high temperature, rain at one address, wind at an airport, a storm track, and a seasonal outlook are separate forecast problems. Each uses different evidence and should be judged with a measure suited to the variable, place, and time horizon.
A forecast can be useful without being exact. If the practical question is whether to carry a jacket during a morning commute, a temperature range and wind estimate may be enough. If the decision involves cancelling a large outdoor event, the organizer needs timing, location, hazard information, update frequency, and a plan for uncertainty. Accuracy becomes meaningful only after the decision and forecast are defined.
Forecast horizon changes confidence
Near-term observations place strong constraints on what can happen next. Satellites, radar, weather stations, balloons, aircraft, and other instruments describe the current atmosphere, though never perfectly. Forecast models use that starting picture to estimate how conditions may evolve. Farther into the future, small differences in the starting state and model behavior can compound, producing a wider set of plausible outcomes.
That is why tomorrow’s forecast usually carries a different kind of confidence from next week’s, and why a range can be more honest than a single value. It is also why responsible forecasts update. A changed number is not automatically evidence of failure. New observations may have ruled out some possibilities or revealed a development that was not resolved earlier.
The useful reading habit is to match the forecast horizon to the actual decision window. A broad daily chance of rain may be suitable for planning flexible errands. It is less useful for deciding whether the next forty-five minutes are workable. Hourly information, radar trends, and official alerts may matter more as the moment approaches.
Location is part of the question
Weather can vary sharply across a short distance. Elevation, coastlines, cities, valleys, and storm structure can produce different conditions within the same region. A forecast for a central reporting station may not describe a specific backyard. Rain at some point in a large forecast area is different from rain at every address in that area.
As a work-from-home dad in my forties with a preschooler in northern New Jersey, in the New York City suburbs, I translate forecasts into ordinary local choices: playground now, errands later, or an event moved indoors. I look at the place and hour that matter rather than treating a regional icon as a promise about the entire day. That small adjustment makes the forecast much more useful.
I also research before I buy, and the same instinct helps with weather products and claims. A badge that says a source is “the most accurate” is not enough on its own. I want to know which variable, geography, time period, and lead time were tested. A service can perform well for next-day temperature in one region and less well for precipitation timing somewhere else. The methodology is the part that makes the claim interpretable.
Probability of precipitation needs context
A percentage for precipitation is often misread as the portion of the day it will rain or the portion of the map that must get wet. Operational definitions can vary by provider, but the displayed value generally represents a probability of measurable precipitation for the specified place and period. The label, location, and time window should be read together.
A 30 percent chance is not contradicted every time the day remains dry. Across a large set of well-calibrated 30 percent forecasts, measurable precipitation should occur about three times in ten. Verification therefore requires many forecasts rather than one personally memorable afternoon. It also requires consistent thresholds for what counts as precipitation.
Different variables need different scores
Temperature error can be expressed in degrees between forecast and observation. Wind forecasts can be assessed for speed, direction, and gusts. Rain probabilities can be checked for calibration and discrimination. Storm tracks involve distance and timing. Severe weather outlooks may be evaluated by whether events occurred inside risk areas, while also considering missed events and false alarms.
No universal accuracy percentage captures all of those tasks. Even an average error can hide important differences. A method may be excellent on calm days and struggle during rare, consequential events. Averages across an entire country may say little about a particular county. Better verification breaks results down by lead time, season, region, event type, and variable.
Ensembles add another useful layer. Instead of relying on one model run, an ensemble explores multiple plausible evolutions. The ECMWF forecast documentation and the Met Office guide to ensemble forecasting provide useful context for that approach. When members cluster closely, confidence in that general outcome may be higher. When they spread widely, uncertainty deserves attention. The ensemble is not a vote in which the most common member becomes certain; it is a structured view of how sensitive the forecast may be.
Official warnings have a special role
General forecast commentary is not a replacement for official local watches, warnings, and emergency instructions. When hazardous conditions are possible, readers should identify the relevant public authority and know where alerts will appear. Australia’s Bureau of Meteorology forecasts and warnings and Canada’s official weather service illustrate jurisdiction-specific public sources. A polished consumer app may summarize conditions, but public agencies issue the notices tied to protective action in their jurisdictions.
The terms also matter. A watch, warning, advisory, and outlook can carry distinct meanings. Those meanings should be read from the issuing authority rather than inferred from everyday language. During fast-changing events, the timestamp and next scheduled update are essential. Screenshots and reposts can remain in circulation after the underlying notice changes.
A practical way to read the forecast
Begin with the decision: what action is under consideration, at what place, and during what period? Then identify the variable that matters most. Check when the forecast was issued, how far ahead it looks, and whether a range or probability is available. As the event approaches, look for updated observations and any official hazard information.
Afterward, judge the forecast fairly. Do not demand exact rain timing from a broad outlook or grade a week-ahead range as if it were an hour-ahead observation. Look for verification across many cases, and be cautious when an accuracy claim omits its test. Weather forecasting is updated guidance under uncertainty. Used at the right scale, it can be highly valuable without ever becoming a guarantee.