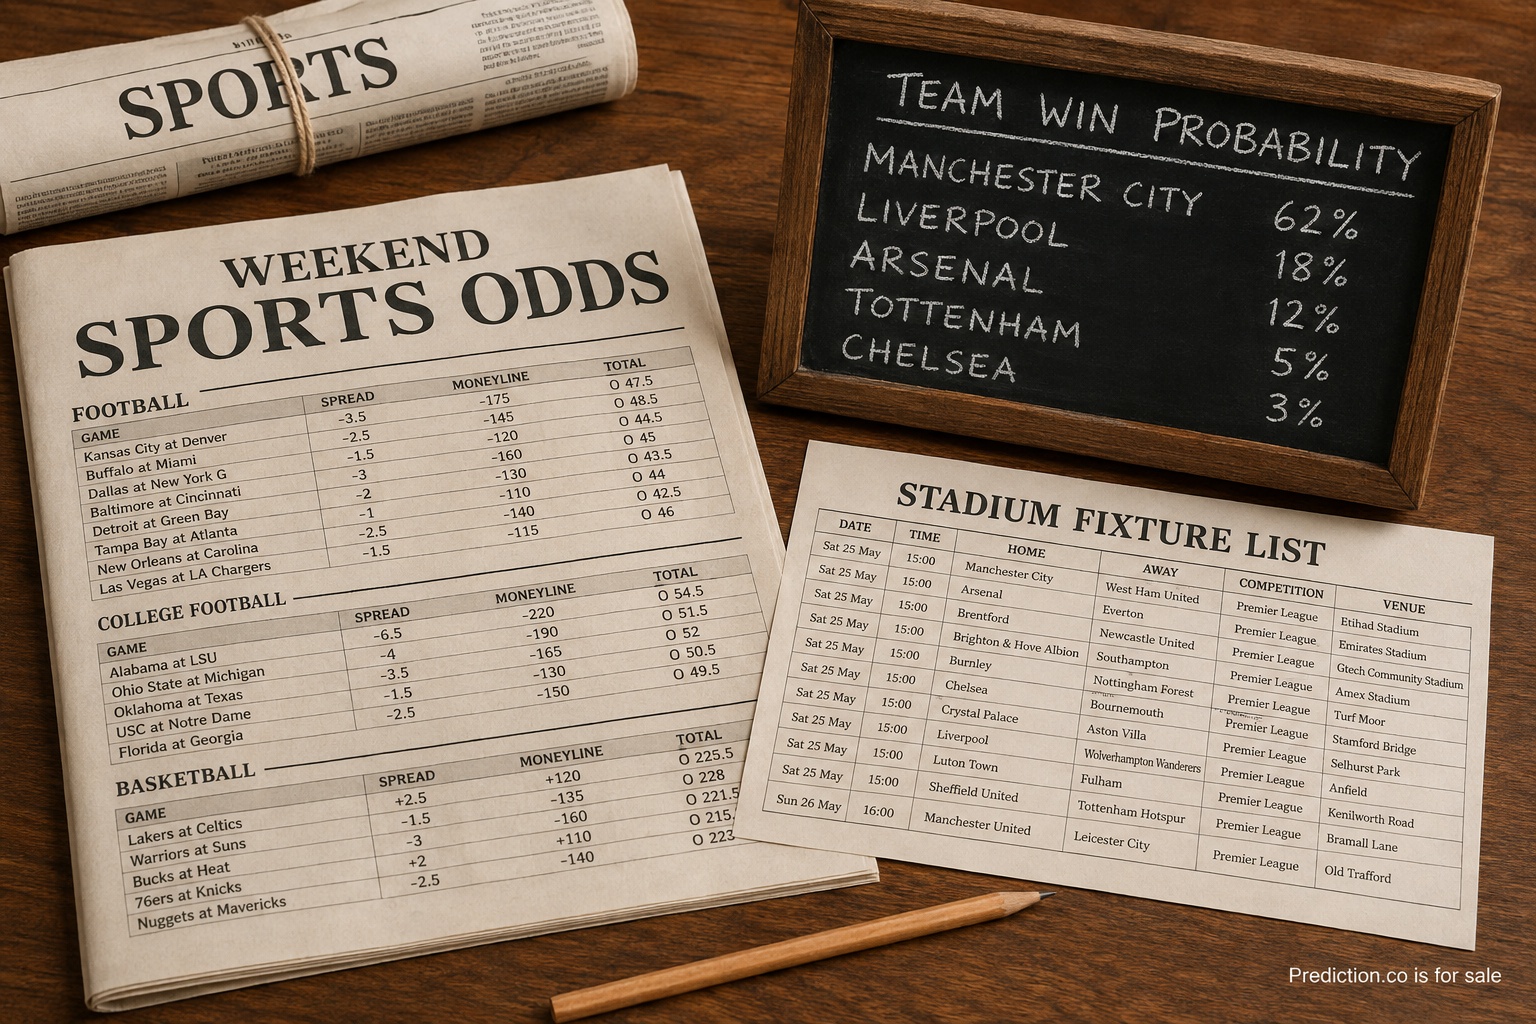
A sports prediction is a probability attached to a defined event at a particular time. Start with those three parts: the number, the question, and the timestamp. “The home team has a 65 percent chance to win” does not mean the game is nearly decided, and it does not mean the forecast will be proven good only if the home team wins. It means that in a large set of genuinely similar 65 percent situations, the favored side should win about sixty-five times and lose about thirty-five.
That distinction is easy to say and surprisingly hard to remember once a game begins. Fans experience one result, not a hundred parallel versions. A late turnover or missed shot can make the eventual winner feel obvious in retrospect. The forecast, however, should be judged using information available before the result. Reading it well requires resisting the temptation to turn every outcome into a verdict on the model.
Define exactly what is being predicted
Win probability, point spread, projected score, player performance, and season outcome are different questions. A model can be strong at ranking teams and weaker at estimating the final margin. A player projection may describe an average across many possible game scripts rather than the most likely exact stat line. Before comparing forecasts, make sure they refer to the same event, rules, time period, and unit.
Also inspect whether the number includes overtime, a particular starting lineup, or a conditional assumption. Tournament forecasts may depend on a bracket path that changes after every round. Season forecasts may incorporate schedule strength and roster availability. Historical records from Pro Football Reference and Basketball Reference can help a reader inspect those broader samples. A clean percentage on the screen can hide these boundaries, so methodology notes and labels are part of the prediction, not optional decoration.
Read the timestamp and information set
Lineups, injuries, rest, travel, weather, venue, and late availability can make an early forecast meaningfully different from a pregame one. Neither number is automatically wrong. They answer the question with different information. A useful forecast page preserves its issue time and identifies material revisions instead of silently replacing yesterday’s estimate with today’s.
I am a dad in my forties living in northern New Jersey, in the New York City suburbs, and I research before I buy. That habit carries into sports numbers. Before trusting a polished percentage, I want to know where the inputs came from, how current they are, and what would cause the estimate to move. I would rather see a sensible range with a clear caveat than a decimal point that implies knowledge the method does not possess.
When I read a forecast with my own rooting interest involved, I also try to name that bias. A familiar team’s recent comeback is vivid; a quiet stretch of ordinary performances is not. Checking the broader record before the highlight reel helps separate evidence from enthusiasm. The same discipline used to compare a major household purchase—sources, tradeoffs, and conditions—works well when evaluating a confident sports claim.
Start with a base rate
A base rate asks how comparable teams or players usually perform in comparable situations. It is the anchor that prevents one dramatic story from carrying the whole estimate. Recent form may matter, but a short winning streak should not automatically outweigh a much larger record. Head-to-head history may look persuasive even when the coaches, rosters, venue, or competitive context have changed. Competition context can be checked against the FIFA men’s world ranking and the Olympic Games record rather than inferred from highlights alone.
The useful question is not whether a model uses a base rate—it almost certainly does in some form—but how it balances stable history against fresh information. A model that reacts too slowly can miss a real change. One that reacts too quickly can chase noise. Responsible forecasters explain this balance in plain language and show enough history for a reader to see how the approach behaves.
Separate probability from price
Odds can express an implied probability, but they may also include a platform’s margin and reflect the activity of participants. Converting a displayed price into a percentage does not automatically produce an independent forecast. When several prices are shown, the implied probabilities can add to more than one hundred percent because of the margin built into the market.
A model estimate and an available price therefore answer related but different questions. One describes a view of the event; the other describes terms at which a transaction is offered. A reader interested only in understanding the game may not need the second question at all. Keeping the concepts separate prevents the display from dictating how much confidence the evidence deserves.
Judge calibration across many calls
An upset does not prove a forecast was poor. If a 30 percent outcome never happened, the forecast would be badly calibrated. The proper test is a collection of predictions. Did events labeled 60 percent happen close to six times in ten? Were 80 percent calls more reliable than 55 percent calls? Did performance hold across leagues, seasons, and different kinds of games?
Calibration is not the only measure. A forecast that assigns every close game 50 percent may be reasonably calibrated but not very informative. Sharpness describes whether a method can responsibly move away from the middle when evidence supports it. Accuracy measures such as log loss or Brier score can reward well-calibrated confidence and punish confident misses, but readers do not need to calculate them to ask whether a published record is complete and fairly summarized.
Look for an archive that retains misses, not a gallery of winning screenshots. Check whether forecasts were frozen at a consistent comparison time and whether cancelled events or changed rules are handled openly. A forecaster who publishes method changes and explains revisions gives readers a record they can inspect. Without that record, claims about performance are difficult to separate from selective memory.
Use the forecast for a defined job
A sports prediction may help frame a broadcast, challenge an intuition, identify a key matchup, or reveal which assumption matters most. It can make watching more interesting by showing how new evidence changes the view during play. It should not be treated as a promise, and it should not borrow authority from precision it has not earned.
The best reading routine is short. Name the event. Check the timestamp. Identify the inputs and base rate. Ask what changed. Compare like with like, then evaluate the method over many calls. A sports probability is a compact argument about uncertainty. Its value comes from the quality of that argument and the honesty of the record, not from pretending that an uncertain game has already been played.