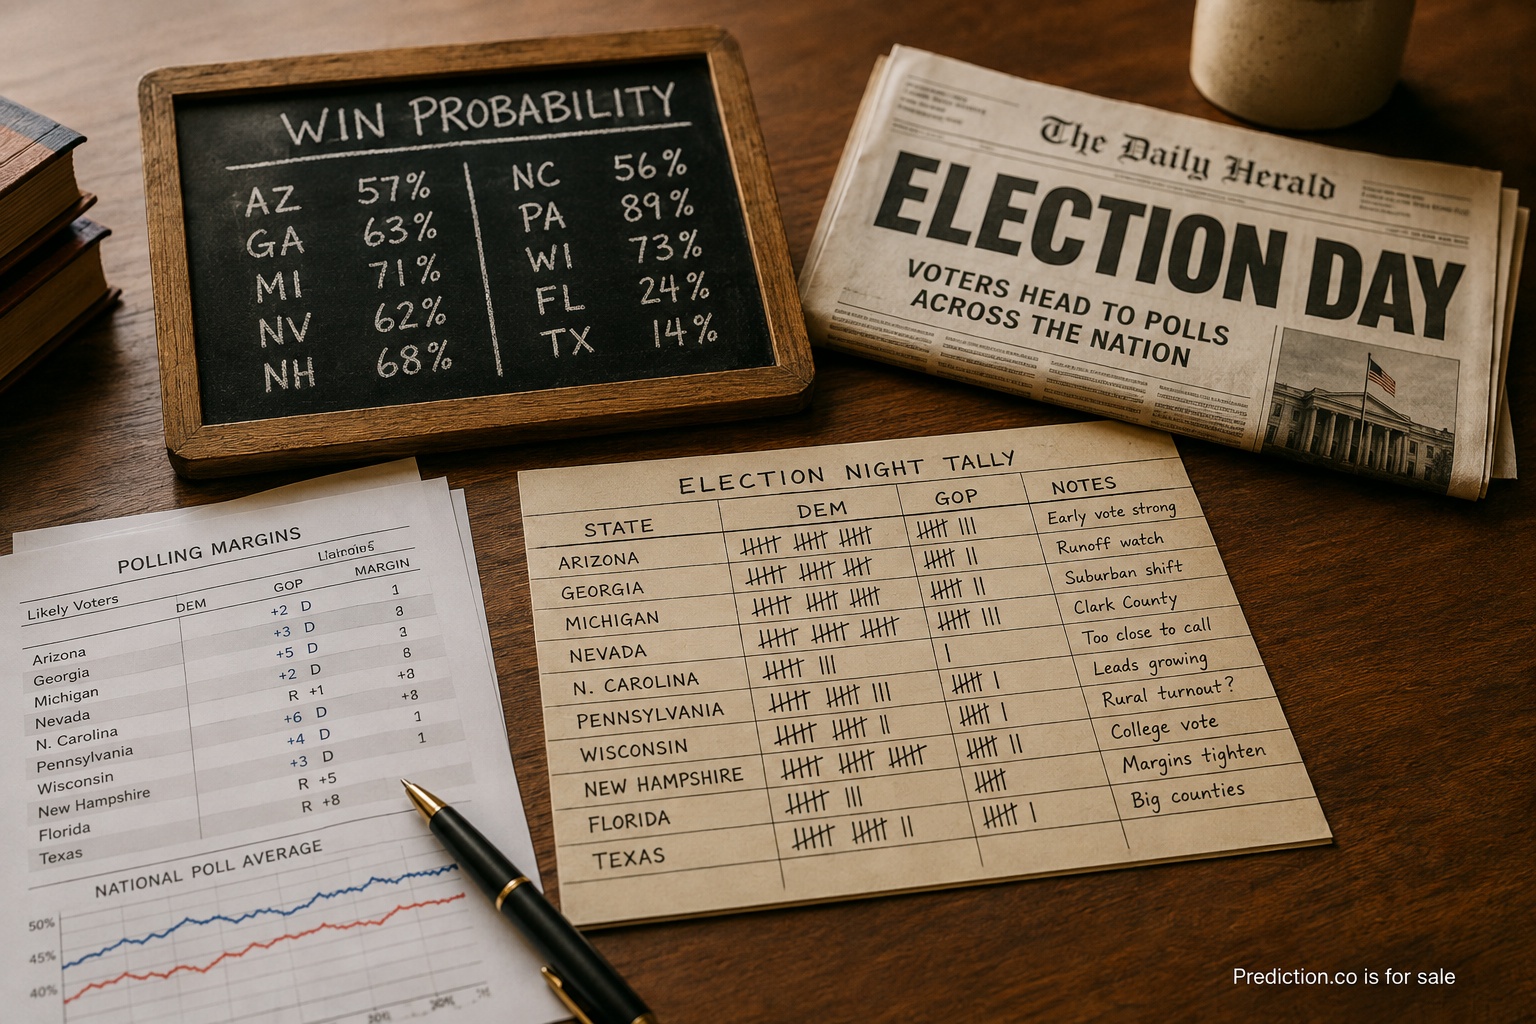
An election forecast estimates possible outcomes using a defined method. It may combine polling, historical patterns, geography, economic information, fundraising, expert ratings, and assumptions about turnout or correlated error. The result can be informative, but it is not an early vote count and it is never a substitute for the certified result.
Begin by reading the forecast’s question exactly. A probability of winning, an estimated vote share, a projected range of seats, and a rating such as “lean” or “toss-up” are different outputs. A candidate can have a relatively high chance of winning while the expected margin remains narrow. A party can be favored to win a chamber while uncertainty remains in many individual districts.
Probability leaves room for surprise
If an outcome is assigned a 70 percent chance, the alternative remains a meaningful 30 percent possibility. Across many well-calibrated forecasts of that kind, the less likely result should occur about three times in ten. When it does, the event may be surprising without proving that the original estimate was unreasonable.
Words such as “likely,” “favored,” and “safe” can make a probabilistic lead feel inevitable. Prefer the number when one is available, then look for the forecast range. A single central estimate can conceal several plausible paths. The width of the range often tells readers as much as the midpoint does about the state of the race.
Probability also depends on the model’s assumptions. It is not a physical property that can be directly observed before election day. Two responsible forecasters can use similar public evidence and produce different estimates because they model turnout, polling error, undecided voters, or relationships among states and districts differently. The disagreement is a reason to inspect methods, not automatically a reason to dismiss both.
Separate polls from the forecast
A poll is a measurement drawn from a sample during a field period. A forecast may use many polls, adjust them, combine them with other information, and simulate possible election outcomes. The polling average and the win probability therefore should not be read as interchangeable. A small polling lead can coexist with substantial uncertainty about who will win.
For polls entering the model, useful questions include who was sampled, how respondents were contacted, when interviews took place, how likely voters were identified, how results were weighted, and how the question was worded. The MIT Election Data and Science Lab research and Cook Political Report ratings offer distinct research and rating contexts to inspect. Sample error is only one source of uncertainty. Nonresponse, turnout assumptions, late movement, and errors shared across several polls can matter too.
A model should explain whether it treats polling misses as related across places. If polls underestimate one side nationally, several state estimates may move in the same direction rather than cancelling one another. A forecast that assumes every race can miss independently may understate the chance of a broad surprise. This is technical, but a plain-language methodology should still acknowledge the issue.
Check the date, inputs, and update policy
Election forecasts change as voting approaches because the information changes. New polls arrive, candidates leave races, district ratings move, and uncertainty about future events shrinks. A forecast months before voting includes many things that have not happened. A final forecast includes more evidence, but it still cannot observe ballots that have not been counted.
I am a dad in my forties in northern New Jersey, in the New York City suburbs, and I tend to research before I buy. When an election graphic travels across a feed, I use the same habit: find the original page, check its timestamp, read what the number measures, and look for the method. A cropped image without its date or label can create more confidence than the source ever intended.
I also compare an update with the previous version before deciding that a race has “changed.” Sometimes the movement is meaningful. Sometimes the display has shifted because one new poll replaced an older one, or because the model’s uncertainty naturally narrows with time. The forecast’s change log and explanation are more useful than a dramatic reaction to a small numerical move.
Understand uncertainty in seats and maps
Seat forecasts add another layer. The expected number of seats is not necessarily the single most likely exact total. It can be the average of many simulated outcomes. A range shows where a large share of those outcomes fall, while a majority probability summarizes how often the simulations cross the control threshold.
Maps can also mislead because geography emphasizes land area rather than voters or electoral weight. A large colored region may contain fewer people than a small metropolitan area. Solid colors can hide close races and give uncertain estimates the appearance of settled facts. Look for margins, probability shading, or district-level detail rather than judging the balance by visual area alone.
Scenario tools are useful when treated as conditional reasoning. They can show how one result changes the combinations still available elsewhere. They should not imply that reporting one contest mechanically determines another. Correlations often arise because places respond to shared national conditions, but every contest retains local candidates, rules, and voters.
Keep forecasting and the civic process separate
Forecast publishers describe possible outcomes under a method. Election authorities publish registration and voting rules, polling locations, ballot procedures, counting updates, audits, canvasses, and certified totals. Readers can use Federal Election Commission election resources as a doorway to official information, while the Census Bureau’s voting data provides population research rather than a forecast. Readers should use the relevant state or local authority for procedural facts. Forecast confidence never changes a voter’s eligibility or the importance of following official instructions.
During counting, incomplete returns are observations rather than forecasts, but they require context. Different places and vote types report at different times. An early lead may reflect which ballots have been counted, not the final electorate. Responsible coverage states what remains outstanding and distinguishes a media projection from an official certification.
Rumors about voting or counting should be checked against primary public sources and credible reporting before being repeated. A forecast model is not designed to verify administrative claims. Mixing model output with unverified process claims gives both more authority than they deserve.
Judge the method over many elections
One correct call does not establish quality, and one upset does not erase it. Evaluation needs a sufficiently large record. Outcomes assigned similar probabilities should occur at similar rates. Forecasts should become more informative as election day approaches without becoming unjustifiably certain. Published archives should preserve final estimates and explain major methodological revisions.
Readers can also ask whether uncertainty was communicated consistently. Did the publisher highlight close races before the outcome, or only after a miss? Were less likely paths described seriously? Was the same standard applied across parties and contests? A transparent forecast makes room for readers to inspect these choices.
The practical rule is straightforward: identify the exact output, preserve room for the less likely outcome, inspect the date and assumptions, and keep official election information separate. An election forecast can help explain uncertainty before results are known. It should never be used to suggest that voting, counting, auditing, or certification no longer matters.