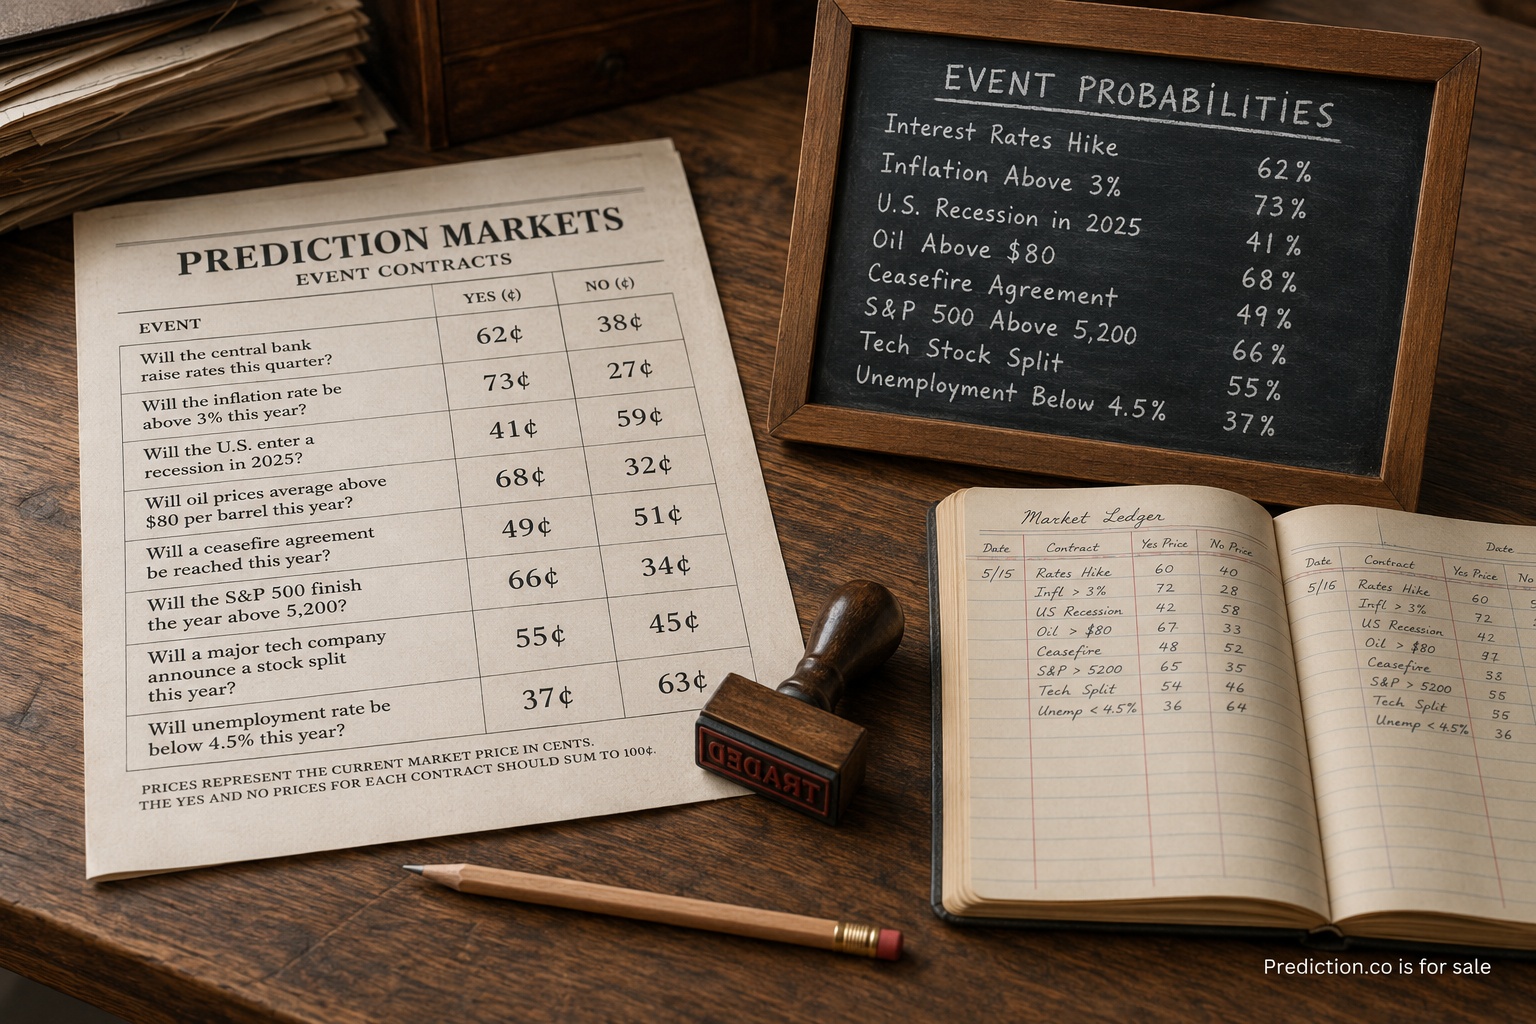
A poll samples responses from a defined population and estimates what that population says during a field period. A prediction market aggregates positions from participants trying to anticipate a resolved outcome. The first is a survey measurement. The second is a participant-generated forecast. Comparing them begins by respecting that difference rather than treating both percentages as versions of the same thing.
A poll might ask which candidate a respondent currently supports, how a customer plans to spend, or whether the public approves of a policy. A market might ask which candidate will win, whether a product will ship by a deadline, or whether a measured event will occur. Present preference and eventual outcome are related, but they are not identical questions.
Start with the population behind the number
For a poll, identify the target population. Adults, registered voters, likely voters, customers, employees, and industry professionals can answer the same question differently. Then inspect how the sample was recruited, how interviews were conducted, the field dates, wording, sample size, and weighting. A representative claim depends on the relationship between the sample and the population it is meant to describe.
For a market, ask who is allowed and able to participate, how much activity exists, whether a few participants account for a large share, and what constraints affect them. The contract pages at PredictIt and the Iowa Electronic Markets make useful examples for inspecting market questions and rules. A continuously updating number can look broadly representative even when participation is narrow. Frequency of movement is not evidence that every relevant group has a voice.
Neither source becomes representative simply because its display is precise. A poll of the wrong population does not answer the intended question. A thin market does not become deep because it shows two decimal places. Labels and methodology provide the context that the large number on the page cannot.
Read the question and resolution rule
Poll wording can shape what respondents understand and which considerations are top of mind. The order of questions, available response choices, and description of an issue can matter. The Gallup World Poll methodology and Pew Research Center methods show the kinds of design details readers can look for. Field dates matter too, because a poll captures opinion during a window rather than permanently.
A market depends on its resolution rule: the exact condition and source used to decide the outcome. Similar-sounding questions can resolve differently because of deadlines, definitions, recounts, cancellations, or the authority named in the rule. Before treating the displayed probability as meaningful, a reader should be able to state what event would settle it.
Ambiguity creates risk. Participants may be estimating both the real-world event and how the written rule will be interpreted. A clear rule reduces that second problem but cannot eliminate every edge case. Changes, disputes, or unusual events should be documented rather than hidden behind the final settlement.
Understand what moves each signal
A poll moves when a new sample produces a different estimate or when an analyst changes the way several surveys are combined. The change can reflect genuine opinion, sampling variation, a different population, altered wording, or a shift in which polls enter an average. One poll that differs from the rest deserves attention, but it does not automatically prove a trend.
A market moves when participants change positions at available prices. That may reflect new information, a reassessment of existing evidence, thin activity, or one large participant. The size and durability of a move matter. A brief jump on limited activity tells a different story from a sustained change across an active venue.
I am a dad in my forties in northern New Jersey, in the New York City suburbs, and I research before I buy. When two confident numbers disagree, I do not begin by choosing the one with the cleaner chart. I trace each number back to the question, people, timestamp, and method that produced it. That usually explains more than the headline comparison.
I use the same routine when a fast-moving chart appears to react to breaking news. I look for the actual announcement, check whether a new poll was conducted before or after it, and see how much participation accompanied the move. Research before commitment is useful precisely because a display can move faster than its context travels.
Do not double-count shared information
Market participants often read polls. They may also use economic reports, endorsements, campaign events, weather, rules, expert analysis, and their own beliefs about future behavior. If a market moves after a poll is released, the two signals are not independent confirmations. The market may simply be incorporating the survey.
Poll averages can share information as well. Several published averages may rely on many of the same underlying surveys. Seeing them agree does not create several independent samples. Good comparison tracks sources and asks how much genuinely new evidence each number contributes.
This matters when building a broader forecast. Combining signals can improve a view when their errors and information differ. Combining the same evidence in several wrappers can create false confidence. A transparent method identifies overlap and avoids rewarding a popular input multiple times just because it appears on multiple pages.
Price is not always probability
A displayed market price is often discussed as an implied probability, but that interpretation comes with assumptions. Transaction costs, participation limits, available depth, incentives, and settlement risk may affect the price. Prices on two venues can differ without creating a simple statement that one group “knows” more.
Poll percentages have their own interpretation limits. A candidate’s support share is not a direct win probability. Undecided respondents, turnout, geographic rules, and correlated polling errors stand between current preference and final outcome. Converting a small lead into certainty ignores those steps.
The safest language describes each measure for what it is. A poll estimates responses from its target population under its design. A market price summarizes terms produced by its participants under its rules. Analysts can use either as an input, but should explain the transformation rather than relabeling the original number.
Evaluate records with suitable tests
Poll evaluation can compare estimates with later outcomes while accounting for field date, sampling error, turnout definitions, and late change. It can also examine whether results show systematic bias across many polls. One miss may be memorable, but a pattern is more informative.
Forecast probabilities can be evaluated for calibration. Outcomes priced or estimated around 70 percent should occur at roughly that rate across many comparable cases. They can also be assessed for sharpness and scoring rules that penalize unjustified confidence. A complete timestamped archive is essential; selected winning examples cannot establish performance.
The comparison should match the job. If the question is what a population believes today, a well-designed poll directly addresses it and an outcome forecast does not. If the question is what will ultimately happen, a forecast may synthesize more forward-looking information, while still inheriting limits from its participants and inputs.
Use both signals with context
There is no need to declare one source universally superior. Read multiple high-quality polls when measuring opinion. Read the methodology and field dates. When examining a market, read the participation conditions, activity, and resolution rule. Track revisions without assuming that speed equals truth.
Agreement may increase confidence only to the extent that the sources add independent evidence. Disagreement is not a nuisance to erase; it can reveal that the signals answer different questions or make different assumptions. The productive response is to locate the source of that difference.
Polls and prediction markets can both contribute to a broader understanding when their limitations are explicit. Neither reports future certainty. The reader’s job is to identify who produced each estimate, what question it answers, when it was measured, and how it can be tested. Context turns two competing-looking numbers into two tools with distinct and sometimes complementary uses.